Session Presentation: Technology in Transportation

Hello, and thank you for joining the presentation. My name is Mike Tavani. I'm a Utility and Grade Crossing Administrator with the Department of Transportation here in Pennsylvania. Today, we're going to be looking at the Utility Relocation Management System. This is a web-based application that we put into production in November of 2020. So, before we get into the new application, I just want to touch on exactly what sent us down the road of developing a new application to manage utility relocations. I think it's no surprise to everybody, especially those here participating today, that you know utilities do present a huge risk to most highway and bridge projects. They're a huge risk. They're
especially a risk in construction. They're a huge risk to the project's schedule overall. One of the most difficult things that PennDOT has discovered is being able to substantiate utility claims after construction projects been delayed. That's where I listed here: show me the data. It's difficult to find that data given PennDOT's current recording of utility involvement in the field.
Next is, you know, if we're going to be looking at the utility involvement with a more powerful microscope, and we also need to be looking at ourselves too. Is there anything that we are doing here at the department to contribute to project delays when it comes to involving utilities? So not only was the application aimed at trying to improve the coordination with just utilities, but also aimed to help us clean up, you know, some of the practices that perhaps weren't ideal in our efforts to coordinate with utilities. Our previous application URDEMS was showing its age quite a bit. It was developed in 2004 and put into production in 2005. I'm sure you can imagine thinking back to your cell phone in 2005, the technology back then. It really wasn't that robust. The internal users would have to utilize it on a PennDOT network in our business partner web portal, which was added in 2006.
Was not much more than a FTP site. For those that remember what an FTP site is. So part of the project kickoff we undertook a process mapping the utility relocation process within the department. This helped us identify certain gaps that existed in our current process. One of those gaps that's most notable was the gap between design and construction.
When a project was fully coordinated, and we had a utility clearance in hand, and where the project would be advertised and put out for a leading, the design group, you know, would move on to the next project because there's always the next project, and the construction group would pick that project up and carry it forth. You know, to take it into construction and get it constructed, and a lot of information was lost, you know, in that transition. Second here is we had a sharp two product that we were working with which was managing utility conflicts. This was a great product. We were fortunate to get some training to our project management teams, also our utility units, by utilizing this particular sharp 2 product. It really ended up being the driving force and probably the heart of our app, our
new application. We also reached out to some of our utility partners. We met with them in person, asked them what their pain points were with PennDOT projects. We also wanted to know what was in their toolbox in terms of managing our project load. You know, what kind of tools they were using, what kind of applications they were using, reports and so forth, to manage our workload, and then we went out to our PennDOT districts and we interviewed them to find out some of the same information. You know, what are they using outside of our current PennDOT applications to manage
their project load. You know, what would make their life easier, what would get them back to focusing on utility coordination rather than process and paper. So a culmination of all this quite informed the development team and kind of laid the groundwork in the roadmap, you know, for the for the future development of our application. So our new application is a web-based app and we like to say that it was created to deliver and communicate project information to involve utilities. We also describe it as a project collaboration platform.
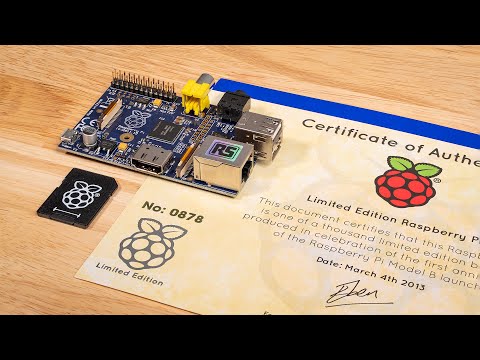
A place where everyone involved in a project can come and collaborate and coordinate any of their involvements. Whether it be with another utility or with a department or with a municipality, one of our many municipalities. The application is being released in three phases. The first release went live into production in November 2020. Second release was done so in May 2021, and our third and final release is coming up here in November this year. Since November of 2020, we've accumulated almost 1,700 users.
About 1300 of those users are what we call B- users. So these are users like utilities, utility consultants, also PennDOT consultants, and a little less than 500 of the users are actual Department of Transportation employees, so these are project managers, district utility coordinators, administrators, and so on. So during our utility interviews, one of the most consistent pain points brought up was the inconsistencies across our districts and how they communicated and coordinated projects with utilities, and while we do have a design manual which was our guiding policy, that doesn't necessarily mean that every district utilize technology to communicate with the various utilities in a consistent manner. So it was important for us to bring some of that consistency
and add some structure to it and on screen, you'll see here, we have about nine project statuses. These project statuses end up being very meaningful. They have specific business rules built into them which means that when you see a project status of any of these, you know that there's critical project milestones that have been met, you know, in order for that project to make it that far. So it also helps give our project teams, our project management teams, some easily not recognizable statuses for them to know that the project has crossed certain project thresholds and is ready, perhaps, for the next step of the process. As I'd indicated earlier during the development of the project and the application, we identified that the conflict management approach was something that we wanted to integrate into our app, and we did. So what you see here up on screen is just a
screen capture of the UCM, or the Utility Conflict Matrix. It provides us a place to record/identify utility conflicts and manage those conflicts and risks on an individual basis. It gives transparency to not only our project team but also the utilities as to, you know, what facilities we've identified and what kind of recommendations we have relative to those conflicts that we've found throughout our reviews and development of our project. Not only does it capture information that's meaningful to the designers and utilities, but it also captures information that is going to be useful when it comes time to look at cost obligations and reimbursement to utilities, so we're able to leverage this conflict matrix not only from a technical perspective but also from an administrative standpoint and help facilitate those utility agreements further down the line.
One pain point that was consistent almost across all utilities that we interviewed was the variation in communication styles that varied across the different project teams throughout our program. So whether it was PennDOT employees contacting utilities, design consultants working for the department, design build contractors trying to design and construct projects in the field, or even local project sponsors, utilities were being hit with correspondence and informations from so many different ways that they indicated that it was difficult to know, you know, what was the latest information on a given project. So we sought out to consolidate all those communications under one umbrella, and that's our application. It was in the application. You're able to build a project team, not only a design project team for the highway project or the bridge project, but the utility has the same ability to do so. They can add a design contact, an administrative contact, or a construction team member. In
addition to that, these various team members are then utilized, or these roles are utilized, to distribute different correspondence, different plans, different deliverables, and also to give friendly task reminders of outstanding items that are necessary for the delivery of that project. In the end, the goal was to be able to build a team and then keep that team as informed as you can on a given project. Sharing a mutually beneficial data, we knew right away from the get-go that we would not be able to increase our usership of our application unless some of the information in our app, some of the features of our application, were beneficial to the utilities, so with that we developed our application always with the mindset of, you know, what can we do to help provide information that's beneficial to not only the department but also to our utility partners. So some of that can be direct access to our environmental documents, direct access to a given company's hop history. So if I'm a gas company, I can see my hop highway occupancy permit history directly within the application. I can see what bridge attachments I have. Our one map provides
a whole lot of information that's useful to different permitting agencies and utilities trying to seek for those permits. You'll also notice throughout our application that any time there's a list, you're able to export it and directly download it to excel and take that file and and utilize it to populate their own enterprise systems, so again, mutually beneficial data we knew would be a commodity that would help us increase the ship across our application. So another factor that the utilities indicated to us was it was a pain point was making sure that they always had the most reliable and up-to-date project plans, schedule, and information. So there's various screens throughout our application that provide that to the utilities. This one in particular that's on screen is what we call our project checklist.
Now this is a view from the PennDOT side, or the utility or the PennDOT consultant side of it because you're seeing all the utilities involved on the project. A utility would only see themselves if they were logged in as a utility, but this gives them a single view, single page, where they can go get all the pertinent deliverables, see all the plans that were associated with a project. All the past versions of those plans are available to them here along with some additional information, but again, this brings it all into one page, onto one location, so that they can be assured that they have the most up-to-date info on any given project. I had mentioned earlier that one of the largest gaps in our process ended up being the transition between design and construction. This is one of the solutions that we utilize to help fill that gap throughout the project coordination with utilities. We would develop a list of different relocation activities that are necessary. On screen,
you'll see a few of those particular activities like install new poll, install conductors. These are activities that are easily recognizable by highway inspection staff, and it gives them the ability to keep track of, you know, what kind of progress a utility is having out in the field. This information is then batched and sent and fed back to our application in a nightly process, so this gives our utility partners and ourselves an insight to what's happening in the field on any given project on any given day. So, in order to wrap up our presentation here, there's quite a few things that we don't have time quite to show everybody, but there's quite a bit more to our application than just a few screens that i was able to show you today. So anything from handling of the utility occupancy permits to production of notice to proceeds, capturing of cost estimates, production of reimbursement agreements. Pennsylvania does cost share with our municipalities when we impact them on our projects. So we quite often are sharing in those costs with our municipalities
which have to be done by an agreement, and we also allow utilities to invoice us via our application. There's so much more to the application, and I wish I had more time for you here today but I'd be more than happy to take some questions here at the end before we get to some questions. I just want to touch on one of the probably the most difficult things was for us to launch an app during a pandemic. We were originally slated to launch our app in March of 2020. We had training lined up with our various utility partners. We had it scheduled rooms booked, computer labs booked across the commonwealth, and we were all prepared to do in-person training. Then everything went on lock down and pretty much turned our training plan on its head.
So what we ended up doing was we fell back and it's began to develop a suite of about 70 videos. These videos range in duration from anywhere from one to three minutes, and they go specific to the topic so, and we have them organized by the different project statuses that are built into the system. So depending what project status you're at, you would navigate to this page, go to that project status, find the topic that you were hung up on, and then watch a short video on exactly how to utilize that particular feature of the application. So again, that was quite a bit of information in a short period of time, and our application has so many features that it would be difficult to even do this in an hour, but I would encourage everyone to utilize the link on the page here. You can go to www.urms.pendot.gov, and once you get there, we have a couple various links here on our home page if you want to register for an account, if you're a utility in Pennsylvania or a consultant designer that operates and does work for the Department of Transportation here in Pennsylvania. I'd encourage
you to go ahead and register on the bottom of the page. We have three links. We have a what's new that'll take you to a webpage right here at penn.gov, and on that webpage, there's various information flyers, newsletters. We do have a newsletter that goes out about every quarter now. If you need help registering, there's a help right to register button there that'll show you the YouTube video, and then there's a contact us there if you have any questions about the application, you can drop us a note by clicking that. And with that, I'd just like to thank everyone for taking the time to watch the presentation here today and for participating in the Innovation Days. Again my name is Mike Tavani. My information is up on the screen. Don't hesitate to reach out to me with any inquiries about
our application or any questions in general about our utility or grade crossing program. I'd be willing to take any questions that you have at this moment, so I'll go ahead and turn it over back to the moderator, and if you have any questions, feel free to ask now. Thank you. Good afternoon everyone. My name is Piervincenzo Rizzo. I am a professor in the Department of Civil Environmental Engineering at the University of Pittsburgh. Today we'll talk about
a project that has been conducted and is being conducted with the support of the offender with work order zero zero three, and this project is about assessing structural monitoring for rich structures. Briefly, the outline of the presentation. I will introduce the concept of SHM, and then I'll briefly review the scope of work of the project, and most of my talk will be about presenting some of the findings of the first three tasks of the project. I will end my presentation with the conclusions and then I will open the floor to the Q and A. So what these structural monitoring of, structural monitoring can be defined as the non-invasive 24/7 monitoring of engineering structures with the scope of detect anomalies or to characterize the static and dynamic response of those structures to external loadings. Systems typically measure individual parameters such as a strain acceleration just to mention a few. While hardware and software store the data, stream the data, and process the data
in order to extract damage sensitive features or to strut information that can be used by engineers to understand that the structural response, the dynamic response of those structure to external loadings a typical schematics of structured monitoring for bridges is presented here. There is a given structure with the sensors that are installed in some components that are deemed to be critical, and then the data are stored into a repository and then processed in order to provide safe all alert messages to the bridge owners or to whoever is interested on these structures to guarantee the safety and the continuous operation of the structure itself. Why? For bridges, there are many reasons. The two most important to me are again detecting defects
that might have occurred or might have been exacerbated between the two maintenance schedules, and also to verify the long-term performance of the bridge itself under environmental and traffic condition. The project, the scope of work, consists of ten tasks which in a nutshell are summarized here. I emphasize the involved, the tasks that I will be talking about today which are monitoring the U.S. bridge health monitoring programs over the last 20 years. Focus on the 10 bridges in Pennsylvania that are part of the PennDOT pilot bridge instrumentation program, and then summarize the conditions of these 10 bridges based on the last bridge inspection reports, and last but not least, for today, to provide some analysis of the data that the sensors read from the field and then are stored into a remote repository. So let's begin with the task one. The scope. For the main scope of this task
one is a thorough review of current and past SHM systems installed in U.S. bridges we look at. We looked at peer-reviewed documents and other technical reports that are a public domain, and we identified the 67 bridges that have been instrumented with some sensors and with a clear SHM strategy in mind. This is a list of 27 out of 67 bridges, and this the partial list is organized according to the brief type. So what were our main conclusions for this task one? We found that the main sensing methods are based on accelerometers displacement strain and temperature.
Many programs include at least three different sensor types. One to collect ambient conditions, for example, temperature and wind condition. One is to collect a static deformation, for example, strain gauges, and the one is to collect dynamic responses, for example accelerations. Strain gauges are by far the most common sensor type installed on those bridges. A surprise to us, and they can elaborate more at the end, is that most of these programs really consisted on monitoring a few load truck tests at most. At least this is what has been reported in the literature so only a few programs consist of monitoring structures for a few months. One-two months, and a very few
programs really consisted about monitoring the bridge for more than two years. For the sake of time, I cannot elaborate more but I encourage you, we encourage those of you that might be interested at looking at these three documents that we have published as a part of a task one outcome. task two was about focusing our interest on the 10 bridges that are part of the pilot instrumentation program initiated by PennDOT a few years ago. This is the list of the 10 bridges, and as you can see, most of them are located in southwest Pennsylvania, and I'm very fortunate that four bridges for three bridges are actually in the city of Pittsburgh, and a few others are very close to Pittsburgh. So I don't have to drive much if I need to see those bridges in person. One of the main outcome of this task two was to summarize the current rating of two of those ten bridges, and the ratings were based on the latest inspection reports. Now keep in mind that this table was created in summer 2020, so since then maybe one or two newest reports were published and maybe the ratings would went up. We don't know this, but again, as you can see,
the numbers for some bridges look a bit critical. So task three is what is a as escaped us quite busy over the last year because what we did is that we analyze the massive amount of data that were streamed from those bridges into a repository that we had access to. So we created our own signal processing and statistic analysis in order to identify the challenges associated with SHM in order to address some of those challenges and in order to provide solutions to those challenges. One of the example of these challenges is presented here with this graph. What you see
here is a graph obtained during a track test, and in the vertical axis, we have the strain. What we call this raw strain as a red as measured by the strain gauge, and along the abscissa, the horizontal axis, we have the time frame between 6 a.m to 4 p.m on July 25th 2018. When a truck, a control low track test, was performed as you can clearly see the data, the strain data, the stream measurement are heavily biased. There is a D strand, and this trend is the simple effect of the increase of the temperature of the bridge which changes the, which is the former to some extent the bridge itself. So the peak values that are associated with the track are actually biased in absolute terms are biased by the temperature changes. So what we did is to develop some simple
strategy, some simple signal processing in order to mitigate the effect, and now, as you can see without the truck, basically the bridge the strain is close to zero and the peaks are associated with the true weight of the truck only, and this makes easy the analysis and interpretation of the data. Especially if we want to correlate the strain to a real weight on the structure. Another example is presented here is the analysis of the acceleration data from another bridge. Some of these data, some of these peaks, are actually false positives associated with electromagnetic interference, but overall, we developed a single processing strategy that was able to determine the natural vibration of the part of the bridge where the accelerometer was located that you can see here the frequencies are three-eighths eleven hertz and twenty-two watts, but also identify a sort of peak event that we're likely associated with the some heavy truck that caused some anomalous vibration on the structure itself. Another thing that we did and we believe that represent a great value for bridge engineers is to monitor and compare the raw strain and also the true strength. The raw strain to temperature changes basically we were able to see
whether or not different strain gauges responded equally to the decrease of the temperature. This was particularly important in our opinion to compare adjacent strain gauges because different responses might be symptomatic of differences on the adjacent components of the bridges, or the unsymmetric response of the bridge to identical environmental loadings. So this is another thing that we believe can be done with structural monitor. So in conclusion, we
provided and we investigated the value that SHM can bring to the public, to PennDOT and in general, to DOT agencies in terms of information that can be extracted from those sensing systems. Definitely there are a few things that needs to be kept in mind. The first of all, an adult signal processing is needed to mitigate or eliminate for example temperature bias, but also to analyze and make sense of the terabyte of data that are streamed by those sensors in real time every day. Another thing that we believe this project
is brought to the public is the fact that we have real data from real bridges. For so many months, or for so many years, it's very important and can help the SHM community to grow and and be more effective at providing the information that the DOT owners, the DOTs needs and wants. I like to keep in mind that SHM is a very young discipline compared to more traditional disciplines such as bridge inspections. So, the application of SHM might be more complicated, but not necessarily more expensive than expected, and there is a lot of research out there that are trying to develop strategies to make the analysis of the data more automatic, more effective, and more intuitive to the general public and to the engineers. Let me acknowledge, in conclusion once more, PennDOT for funding this project, and my grad student, Alireza, for being such a great asset for this project, and also I'd like to acknowledge many people at PennDOT that contributed to this project with the productive and constructive feedbacks that we received almost on a everyday basis, and with that I conclude my talk and I open the floor to the questions. Thank you.
Good day. My name is Nick Vivian. I'm the Hydrology and Hydraulic Unit Manager in the Bureau of Project Delivery in the environmental policy and development section. It's my pleasure to present to you the innovation of Displaying PennDOT Assets on Pennsylvania USGS Stream Gages.
This presentation will address the innovative idea presented by Athena Clark, P.E. of the USGS Southeast Region Science Center. The USGS recognized that the data they were collecting was not being portrayed in an understandable manner to the general public due to the fact the organization focuses on delivering data from a scientific or engineering perspective. This is not easily understandable and usable by the public as well as state and local agencies, particularly county emergency management, to allow them to be able to make quick decisions to ensure safety. This innovation solves the challenge with the public
and provides opportunity to expand and collaborate with the state and local agencies. This next slide provides an overview of the recognized challenges with the display and database of the USGS stream gages. As you can see, it provides very limited details and leaves a lot of questions to the average user questions like what is the point of reference, what elevation is the stream bed, how can you tell if and when it will flood. The graphic in the lower right hand corner is an example of some of the social media questions that the USGS is receiving. As you can see, this one is asking specifically for training on how to read this gauge data.
Another issue not apparent to the average user is that the vertical datum of the gauges vary depending on the location and the date it was installed. Additionally, an updated North American vertical datum is expected to be implemented next year in 2022. These are very similar challenges the department faces whenever we're doing a new project or a rehabilitation project. A lot of the old plans are in the north of America vertical datum of 1929 or
the North America vertical datum of 1988. This inconsistencies will have to be corrected. Through survey and data acquisition by the USGS for each gauge, continuing with the challenges, it's important to explain that the National Weather Service is in the forecasting business where the USGS is in is concerned with collecting empirical data and data delivery. So the National Weather Service basically uses radar, it tells and informs the public of how much precipitation is expected to fall at a particular location where the USGS gauges measure exactly how much of that precipitation fell at that location. It's important to note the percentage of the USGS stream gauges that double as forecasting sites are less than 41 percent. There's roughly 9,054 observation sites, and of those, 3,689
are forecast sites. If you look at the graphics that are contained in this slide, the one to the left shows the observation sites and the one in the upper right shows the forecast sites. After examining these facts, what was observed from the current process, well it occurred to the USGS that empirical data measured at each gauge could be used to inform emergency management decisions as long as that data was delivered in a format that is quickly understandable and usable by the public. A benefit of this is that it is not forecasting and outside the mission of the USGS. It is a data delivery keeping with the original mission of the agency. What changes can be made to deliver better usable data to the public? Well one of the first solutions to implement was to collect new survey data that includes latitude, longitude, and elevation of key features for all new gauge sites, as well as updated existing gauge sites including keeping all these gauges and data consistent on one common vertical datum. Another solution was also to partner with other agencies
such as PennDOT and share survey data to minimize cost and streamline delivery when you think about all the gauges that the USGS has most of those gauges are mounted to a bridge or some type of structure and it's usually owned by another state agency or a local municipality. Now, to go and break down some examples of those key features right here on this particular graphic, we show some of those key features right around the stream gage. As that you can see there, it's mounted to the bridge structure. So some of the key features shown on this graphic include the channel bed and banks, so a half full and a full stage can be represented, the nearest street, that being a local street, or a particular state route. As I mentioned before, the bridge deck itself and other items that may be appropriate, such as finish, floor elevations of buildings, or dwellings, this additional collection of features is very reasonable and does not take a lot of time when the crew surveying and collecting the data for the USGS gauge are performing the field work. The additional features will then be entered into the USGS stream gauge plot as thresholds. This gives the public a better understanding of what is happening with the water surface elevation in the channel because there is now a point of reference to compare to. The graphic to the
right shows the key features entered as threshold values and the acquire USGS's AQUARIUS system. What are the next steps? Well, next step is where PennDOT is helping out. A lot of these gauges, as I said before, are attached to Department bridges that were reconstructed or rehabilitated recently. The USGS is currently collaborating with us and sending us a list of their gauges attached to bridges, along with the latitude and longitude of each location. Our staff and the Department is polling plans for each one of these locations and sharing survey data to help streamline this process. As you can see on the graphic on this slide, you can see a USGS gauge mounted to the structure on the bridge.
Once this process is complete, the data will be easily usable by the public. Some examples of how the data will be used are shown on this slide. The public can now go directly to the gate site and get information quickly. The thresholds will appear
when the water surface level reaches specified elevation. The gauge height in feet does not matter anymore because there is a real world landmark to reference from. Here are some examples of how the data can be used by the public in emergency management. So, the graphic in front of you shows that the gauge height is at half bank full threshold. Something you may want to ask yourself is, should I be concerned? Well, maybe. The channel is half full. This might be something you want to continue to watch or monitor. Another example, another threshold gauge height, is it bank full.
Should the public be concerned? Yeah, probably. So, the water is getting ready to come out of the stream, the river, the ditch, the swell. Gauge height just reached the elevation of avenue W or avenue H or your local church street, whatever it may be.
Should I be concerned? Well, yes. The street is flooded. She's beginning to cut off access. Again, same thing for the last bullet for the bridge deck threshold. The gauge height just flooded the bridge. Should you be concerned? Absolutely. Cut off access. This particular slide represents the possibilities for future upgrades. The partnership with the state and local agencies will be significant upgrade to the current mode of operation. This graphic or example shows possible enhancements
once the data is complete. The goal would be for the USGS system to talk first and foremost with PennDOT systems, as well as other important state agencies, such as emergency management again at the state level, PIMA, and at the county level, county emergency management. Future upgrades being considered would be an interactive map that shows flooding in real time. This graphic
here shows pictures developed to represent the key features of channel bank half full, full roadway over top bridge over top, and then in any structure dwellings are inundated and the nice graphics and pictures developed. It helps the public look at the map very quickly. Take in the information and make a quick decision on what to do. In conclusion, this slide displays an example of the finished product once the key feature thresholds are entered. Here's an example of a bridge deck. It's represented by the red line on the USGS gauge graph.
You can clearly see that the water surface elevation is slightly below the bottom of the beams on the bridge deck. Compare this to the existing way that the structure was monitored to the picture to the right. There were four people that would drive around during a storm event. Again, not very safe, and take field measurements, so this is a perfect example of why real time information and having a reference point on the USGS gauge graph is prudent.
This concludes the presentation about this particular innovation, and I will gladly address any questions you may have. Hello, my name is Drew Ames. I am the Environmental Planning Manager in the environmental policy and development section of the Bureau of Project Delivery, and I'm here to talk today about our Environmental Commitments and Mitigation Tracking System, which is an ECMTS, and how we replace an unreliable paper-based system with one in ECMTS that works a lot better. So, before getting into the system, I'd like to talk a little bit about what environmental commitments are. When environmental mitigation is the CEQ, the council on environmental quality, which is an office of the White House, defines mitigation as a series of escalating actions that we can take to offset impacts to the environment from our projects. So at the lowest level is avoiding the impacts altogether and examples of that would include and a restriction on when we can do certain activities to a time of year. For instance, when we cut
trees, we do a time of year restriction to avoid cutting trees when endangered bats are roosting in those trees. So we avoid the impact by placing a time of year restriction. Minimizing impacts can include things that we do during design to shift the alignment of a roadway or to specify steeper slopes. When we have a cut to reduce, the amount of right-of-way that we need to take rectifying the impact is putting things back the way they were when we're done, and reducing or eliminating the impact over time can include some of the work that we do on stream banks. For instance, doing stream bank restoration or placing certain structures within the stream to help establish fish habitat. That takes time to really become effective, and finally,
compensating for the impact is what examples include paying into a fund like the bat fund that's dedicated managed by another agency. That's dedicated to establishing bad habitat or compensating property owners for property that we take. So these are all different kinds of actions that we take that we are required to do by law when we have an impact to the environment.
The Federal Highways regulations, as well as other regulations that we follow in the environmental process, state that mitigation must be included as an integral part of alternatives development and analysis. So when we're looking at different ways of addressing project needs, different ways of building the project, we look at different impacts those alternatives would have, and we consider how we mitigate those impacts. At the same time, agencies are responsible for identifying and including all relevant and reasonable mitigation measures that could improve the action. So we're on the hook to look for ways of reducing our impact, on mitigating for impacts, and that process of reducing or mitigating for impact starts at the beginning of the NEPA process. As soon as we start scoping under the National Environmental Policy Act. The environmental process that we follow, we start looking for ways to mitigate for impacts that our project may have.
So why do these commitments matter? PennDOT and federal highways make binding promises to take certain actions during and after construction. Those promises are what help us get the NEPA approval, and failure to fulfill those promises results in construction delays and the possible loss of federal funding. So a very simple example, if we make a commitment to not stage construction materials in the parking lot of a nearby park, and the contractor goes ahead and stages in that location anyway, we will shut down the project until they move stuff out and make other arrangements. So there's a delay that happened because the mitigation commitment was not honored. Which is why we have the Environmental Commitment and Mitigation Tracking system. This policy is in appendix T of design manual 1X. It is required on all projects,
and we start tracking with NEPA approval. So during the NEPA process, we identify the mitigation commitments that we're going to take once that approval happens, whether it's a categorical exclusion evaluation, an environmental assessment, or an environmental impact statement. Once those approvals happen, then we start tracking what happens to them after NEPA. The ECMTS really has two functions. To ensure that the commitments and mitigation activities happen during construction, and then to document that they were met. So when federal highways asked us about those activities in the future, we can show that they were done.
So, the original mitigation tracking system was a spreadsheet, and this is a screenshot showing how it was filled out. The main point isn't necessarily what it says. The main point is that this spreadsheet is an excel file that had to be filled out manually and sent from the project manager or the consultants, with help from the environmental staff, to the folks managing the contract and advertising to the contractor. This is a screenshot of the signature sheet that we expected the contractor and the inspector in charge to fill out when each activity was completed during construction.
Again, another paper file. This was a word file. So, the prior paper-based system was not working well. Federal Highways did an IOP review in 2017 and found that, of the projects that were reviewed that were in construction during this IOP, 43 percent exhibited non-compliance with environmental mitigation commitments. There were 16 instances of non-compliance, and the most common violation was having to do with an aid to navigation sign in, a stream not being installed. But there were other examples. Cemetery access that was closed that we promised to keep open. Exclusionary construction fencing around wetlands that was not installed and were not actually depicted on the project plans, even though we promised to put them up, and a recreational trail that was closed even though we had promised to keep it open.
These are some of the examples that were found. Additionally, not everybody at the project site knew about the mitigation tracking system or the spreadsheet or the signature sheet. Not all individuals could locate it, and there were three projects that were reviewed that did not have a special provision requiring the ECMTS to be maintained, and that is something that the policy required, and even when they did have the spreadsheet, not all of the commitments appeared on the spreadsheet that we had promised to do during the NEPA process. So, as part of responding to the IAP finding, we started really digging to find out why things were not working, and it basically boiled down to the fact that there are multiple manual steps that had to be taken that could fail at any point and often did. So, the first step was to fill out the spreadsheet. Then, during the final design,
some of those activities might need to be updated. So they had to be updated if something comes out of permitting or right-of-way that needs to be added to it. They need to be added and people need to know about this and keep that spreadsheet up to date. Then everything needs to go from the spreadsheet to the appropriate plans, such as showing wetland fencing on the erosion and sedimentation control plan, and creating special provisions for mitigation activities that require them. After that, all of these things need to be communicated to the contractor and make sure that those activities happen during construction and get signed off when they're completed. Then finally, once the project is all wrapped up, any commitments that we made for maintenance or monitoring. Storm water control facilities
are often an example of a facility that needs to be monitored after construction. As are permitting responsible wetland mitigation sites that we create during construction. That all needs to be communicated to the proper units. Either county maintenance or back to the environmental unit if they have to monitor a wetland. So, we worked on a solution, and the solution was to do a number of different things, but the first was very simply to step up the QA reviews on mitigation on construction projects, and we now get a quarterly report from the QA unit under construction led by Brent Triplepiece who fills us in on the inspections they've done and whether or not there were any problems with mitigation. We are wrapping up the process of updating appendix T of DM1X to reflect the changes that have happened in our procedures and updating the project office manual to emphasize mitigation and pre-construction meetings to make sure that not only is the system that I'm about to talk about in place and working, but that the contractors understand what's expected during construction.
And then the really innovative part of this was to move the tracking into ECMS. A lot of what we do with mitigation is try to get it into the contract documents so that we're updating special provisions, we're putting notes on plans, we're putting drawings on plans, and now we have this additional checklist of mitigation activities that need to happen. So, moving all of that into ECMS put it in a system that has rules and validation and roles and responsibilities that are well defined, and we can do things like make sure that everything that needed to be done prior to advertising is actually completed, and that the project development checklist is up to date based on what's actually in the system. At the other end, we can make sure that the project isn't finalized until all of the construction mitigation items have been closed, and there's a process for closing them in the system when they're completed during construction. So, ECMS eliminated the problems of moving information from design to construction to post construction manually, relying on email attachments, and it automates the communication among the inspector in charge, project inspectors, contractors during construction and really helps loop people in that need to be looped in during that process. So now, the system went live back in February of 2020, and when you log in now to a project in ECMS, you'll see under the solicit column there's a mitigation link, and again, under the construct column, there's a construction mitigation link.
When you click on those links, you will see what is now the spreadsheet but in ECMS. So, we have a column for activity description, we have the MPMS number, and ECMS projects can have multiple NPMS numbers, and the system is intelligent enough to enable us to do that. There's an activity status, so mitigation activities can be active or closed. There are some things that we promise to do during final design that we expect to be closed prior to the project being advertised, and you can see the activity phase, the column, we have final design, construction, and then what the system calls post finalization maintenance and post finalization monitoring. So storm water control measure that needs to be where we need to notify the proper people that there's maintenance associated with that, recurring maintenance, that gets tagged in the system for post finalization maintenance.
Similarly, if there's post finalization monitoring for a wetland that was created, for instance, that we need to monitor for five years to look for invasive species and make sure that the wetland gets established, that gets tagged as post finalization monitoring. We have resource categories, and those are helpful when creating the mitigation items and it helps us figure out whether it has to do with archaeology or streams, public involvement, just what category the mitigation activity or item falls under. There's a reference to the PSNE, which plans. So, in this example, there are some that most of these are actually on the E & S plan, the erosion and sedimentation control plan. We have start dates and end dates. These are helpful for when we have time of year restrictions. So if we have to stay out of the stream between January and March, that will be noted in the mitigation item and will show up on this screen. Okay. Each mitigation item, when you click on it, has a detail screen, and it has the
same information. This is very terse data in the ECMS test system, but I think it shows a few things that are worth noting. So when you enter the information, you can choose a source document, and so that could be the NEPA document, the CE. It could be the permit. It could be a
letter of agreement between PennDOT, Federal Highways, and the Historical and Museum Commission. It could be a Section 4F document that's attached to the NEPA document. So we list the source document. We have an activity description, and that's stating what actually needs to be done or not done. We specify the resource impacted and, in this example, it's the Susquehanna River. On the right hand column, we really urge people to put construction stations into the mitigation items. So especially where you have wetlands or other features that can
correspond to a construction station, it really helps locate where it is, the PSNE reference, if it is on a plan or, you know, note on a plan or a plan sheet. Then we ask that that be filled out, but we also have the ability to link to special provisions, and when people enter this information in ECMS, they can click on the magnifying glass icon which will take them to the list of special provisions that have been created, and if the special provision has been created that's related to this mitigation item, that link is established so we cross reference with the special provisions. You'll also note that there are up to three pair of start and end dates for when we have time of year restrictions that covers multiple construction seasons. Okay. The innovations that I just demonstrated in the design side, the solicit side,
of ECMS carry over to the construction side of ECMS, and there the inspector in charge is really the person most responsible for maintaining the ECMS, the mitigation tracking ECMTS and ECMS, and the IIC can update mitigation activities. So, time of year restrictions we sometimes get a waiver from, for instance, the Fish and Boat Commission to change the time of year restriction. Maybe take two weeks off of it at the end so we can start construction a little bit earlier. Those edits can be made really without any special permissions by the IIC in the system.
However, there is a possibility to do larger edits either to, you know, really change or update something that happened that needs to be addressed during construction, or to actually add an entirely new mitigation item, and that can happen. We've had situations where earthwork ended up uncovering an unmarked cemetery, so we have to stop the work, work with the Historical and Museum Commission to develop mitigation, and then at some point, when that coordination is finished, we actually have to enter into the mitigation tracking what it is that we agreed to do to, you know, deal with the remains that were found in the unmarked cemetery. We've had situations where mitigation actually failed. We had promised to do something, and for one reason or another, we did not do that. We blasted when we weren't supposed to, or we, you know, promised to not demolish a bridge so that it fell into the stream, and it ended up falling into the stream anyway. There are numerous situations that, for one reason or another, don't
work out the way we said that we promised to make them work out, and in that case, we need to close the mitigation activity that we're tracking and close it so that there's an explanation for why we're closing it, and then create a new mitigation activity after coordination with the official with jurisdiction or the agency that has jurisdiction over the resource that we inadvertently impacted. In that case, a work authorization can be created, and once that is done, the IIC can create a new mitigation activity almost invariably with the assistance of the district environmental unit, and that work authorization needs to be entered into the new mitigation activity. So, another part of this is the contractor's responsibility, and the contractors must designate a person responsible for mitigation which is a security role in each CMS. So, closing a mitigation activity. Say a time of your restriction has ended. Both the IIC and
the contractor's person responsible need to, essentially, sign off on the mitigation activity, and the way that that works is that either one, either the IIC or the person responsible, can initiate the process of closing it, and whoever starts it will place a comment in on the mitigation activity and initiate the close, and then that mitigation item, closing that mitigation item, shows up in the other person's work cue, and that person then also adds a comment, and at that point, the designation switch switches from active to closed on the mitigation item. This is a check and a balance, and this takes the place of the signature sheet that I showed earlier. So it's organic to the system. It's integrated with the system, and it's not something that
requires people passing paper around. The comments are also very helpful. So, in a situation where mitigation does not go well - well in a situation where mitigation does go well, the comments are usually pretty terse. You know, this mitigation item was in compliance and is now closed, and the IIC or the person responsible follows up with their part of the closing procedure and says 'I agree' or something along those lines. But when something doesn't go well, there should be an explanation for why not so if we end up blasting when we weren't supposed to, there's an opportunity for one party or the other to explain why the time of year restriction was violated. Maybe it was, you know, a different interpretation of how the mitigation activity was written, or perhaps there was other extenuating circumstances. So, that's why we have the comments in there, and they really help dissect what went wrong so we can learn from that and move forward.
Another part of this is inspection that is targeted directly to the mitigation activities, and for that, the project site activities, the PSA, was updated in ECMS and in the PSA app to have a section devoted to mitigation items. So, it draws from the mitigation items that are identified in ECMS under the construction mitigation screen, and it works just like construction items. So an inspector chooses a mitigation activity and notes whether or not it's in compliance. If it is not in compliance, the inspector must write a comment and explain what's going on. This is part of the process of tracking and really making sure that both that we do what we said we promised we would do when we made the commitment, but also that we can show in an audit that we were keeping track of the mitigation activities.
A future plan is to have weekly reports run against the PSAs for projects in construction to indicate which items are out of compliance, and another report to show which items have not been inspected, and the idea would be to send those reports automatically to the IIC but also to the ADE for construction and the environmental manager. So, this presentation is more of an overview, not really getting into the nuts and bolts of how to actually use the system. I wanted to focus on the problem we were trying to solve, and how adding the ECMS functionality to ECMTS went a long way towards solving that problem.
We do have training videos, and this slide shows the training videos and the YouTube short links for six videos that we put together for the design side, the solicit side, of ECMTS, and those are available. It's a private YouTube channel, so if you search for it you won't find it, but if you have the link you'll be able to watch the videos. Each video is roughly five minutes long or so. They're not very long videos, but it really gets into the nuts and bolts of how to use the system. Similarly, in PPCC there are four ECMTS training videos, and you can see it's under the references tab, and then you go to central office and then ECMS user guides and videos, and then there's a folder, ECMTS Training Videos, and you can see the sort of the breadcrumb of links in the light gold bar at the top underneath the title bar, and this explains how to close out mitigation commitments. There's a video for the contractor on how to add the person responsible to the team. There's how to edit and add mitigation commitments and monitoring mitigation commitments in the PSA. So these videos are out there. They're relatively
easy to get to. We're in the process of adding the construction videos to YouTube as well and making those links more widely available, especially to consultants who don't have access to PPCC. That about wraps it up for the presentation. I will say that over the past year or so, closer to a year and a half now, we've had a number of questions from the districts as this was rolled out. John Burnett and I presented at a number of winter schools to talk about this. Had some questions from consultants, but generally everything has been very well received, and people find it easy to use. Much easier to use than the paper-based ECMTS. We've also continued to receive reports from Brent Triplepiece and his QA staff, and the mitigation compliance is much better than it was when the Federal Highways IOP happened. Here's my information on the
left. Phone number and email address, and John Burnett's information. He really is the subject matter expert on the construction side and was instrumental in setting the requirements for how that end of the mitigation tracking system works. Thank you for your time and attention.
2022-07-16 12:14