The 1987 Crash

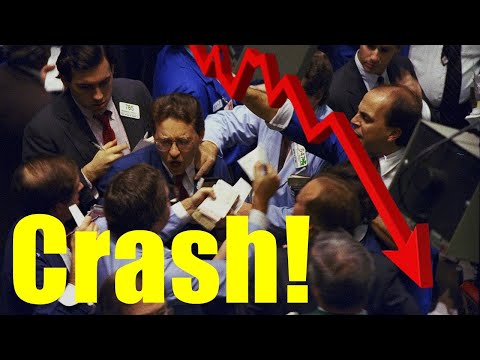
On October 19th, 1987 a date that later became known as "Black Monday," the Dow Jones Industrial Average fell 508points or 22.6%. This was the largest one-day decline that Wall Street had ever seen. That one-day price drop was about the same in percentage terms as the two-day drop that happened in October 1929 on back-to-back days. There were fears in the
wake of the crash that it would lead to another Great Depression, but in fact not even a recession occurred. The unemployment rate was 6% at the time of the crash and it continued declining after the crash reaching 5.2% by the time the stock market had fully recovered in 1989. No one-day drop had ever come close to the magnitude of the1987 crash in the 100 years before the event, nor has there been a drop that severe since. The crash marked the end of a five-year 'bull' market that had seen the Dow rise from 776 in August 1982 to a high of 2,722 in August1987. The day after the crash, many investors feared that the market would topple again like it had in 1929, however, the market rallied immediately after the crash, posting a record one-day gain of over 100 points the next day, a record that was quickly broken on Thursday the 22nd when the Dow rose186.64 points. All in all, it took just under two years for the Dow to recover completely. In today’s
video, we’ll look at the events leading up to the crash, the best explanations for why it happened, and examine how the 1987crash changed both the way market’s function and investor psychology. During the years prior to the crash, equity markets had been strong, so strong that price increases had outpaced earnings growth meaning that price to earnings multiples had expanded significantly. Some of the market strength was down to the favorable tax treatment that had been given to the financing of corporate buyouts, like allowing firms to deduct interest expenses associated with debt issued during a buyout. This increased the number of companies that were potential takeover targets, pushing up their stock prices. The market was off to a great start in 1987, and by late August the Dow Jones was up 69% Year to Date. In mid-October, some bad economic news began to rattle investor confidence leading to increased market volatility. Let’s look at the
days leading up to the crash. On Wednesday October 14th two major pieces of news broke. First, the US House Ways and Means Committee filed legislation to eliminate the tax benefits associated with financing mergers. The proposed legislation would eliminate the tax deductions for some interest expenses and would start taxing “greenmail” payments made by companies to corporate raiders to buy back their stock at above-market prices. This news reduced the odds that certain companies would be take-over targets. Leveraged buyouts were a big part of what was happening in markets at the time, and this law was basically shutting Gordon Gekko down. Second, the US Commerce Department announced that the trade deficit for August was notably above expectations. This caused the dollar to decline, increased expectations that the Federal Reserve
would tighten policy and pushed up interest rates, putting further downward pressure on equity prices. On Thursday October 15th, equity markets continued to decline. The press at the time attributed this to investor anxiety. Friday October 16th the day before the crash was what is known in markets as triple witching, a day when stock options, stock index futures, and stock index options all expire on the same day. This happens four times a year and usually causes
higher trading volume and unusual price action in securities as traders rebalance their hedges. Price declines over the prior two days had eliminated many at-the-money options so investors couldn’t easily roll their positions into new contracts for hedging purposes. This pushed more traders into the futures markets, where they sold futures contracts as a hedge against falling stock prices. By the end of the day on Friday, the stock market had fallen considerably,
the S&P was down over nine percent for the week. This was one of the largest one-week declines that had been seen in the last twenty years, and it helped set the stage for the chaos that erupted the following week. There were signs that futures markets were already being overwhelmed by heavier-than-usual volumes that Friday, as traders on the CME had to meet up on Saturday to try to settle positions and sort out holdings. The weekend break didn’t offer much reprieve either as on Saturday, Treasury Secretary James Baker publicly threatened to de-value the US dollar in order to narrow the nation’s widening trade deficit. That brings us to the day of the crash, but first I have to explain what is meant by portfolio insurance and program trading, as these two trading strategies are widely blamed for the 1987 Crash. Portfolio insurance was a
trading strategy that had grown in popularity in the late 80’s and was supposed to limit the losses investors might face from a declining stock market. Broadly speaking, the strategy used computer models that would add to your equity exposure as markets rose and cut your equity exposure as markets fell. Portfolio insurance gave investors a payoff similar to being long a call option in that it gave investors upside exposure but limited downside risk – at a cost.
Portfolio insurers at the time didn’t update their models constantly, and there were a few reasons for this. Firstly, because computers were a lots lower and more expensive back then. And secondly, they wanted to minimize their rebalancing as transaction costs can really add up the more you trade, cutting into returns. Instead, they updated their models occasionally, often after large market moves and then traded in batches. This could add to market volatility as occasional large orders hit the markets. Anyhow, that is portfolio insurance is. The next trading strategy we need
to understand is “index arbitrage,” which aims to generate returns by exploiting differences between the value of stocks in an index and the value of stock index futures contracts. If the value of the underlying stocks in an index was lower than the value of a futures contract, then arbitrageurs would buy the stocks and sell the futures contracts short knowing that the prices would have to converge before the expiration date. When the value of stocks in the index was above that of the futures, arbitrageurs could do the opposite. That is how index arbitrage works. Ok, so on
Monday October 19th, there was substantial selling pressure when the New York Stock Exchange opened. Due to buy/sell order imbalances, many specialists didn’t open the stocks they covered for trading during the first hour of the trading day. 11 of the 30 stocks in the Dow opened more than an hour late, and stocks representing one third of the value of the S&P500 were still not open by 10AM. Now, stock index futures did open on time, but with so many stocks not trading, some of the quotes used to construct the stock market indices that these futures tracked were stale.
The price of an index is calculated using the most recent price quotes for the underlying stocks. Because out of date stock prices – ones from last Friday - were being used for over a third of the value of the index, the Dow and the S&P didn’t decline as much as they would have otherwise. The index levels didn’t represent what was happening in the market. So, the futures market was actually
reflecting the heavy selling that was happening and because the futures fell much more than the cash market appeared to, a gap was created between the value of stock indices in the cash market and in the futures market. Index arbitrage traders who used computer systems to take advantage of divergences like this were buying futures (which looked relatively cheap) and sending sell-at-market orders to the New York Stock Exchange – but for stocks that were often not yet trading. When these stocks finally opened, prices gapped down due to the accumulated sell orders and the index arbitrageurs discovered they had sold stocks at considerably lower prices than they had expected. When stocks gapped down like this, portfolio insurers’ models prompted them to sell. The record trading volumes hitting the exchanges that day overwhelmed many automated systems.
Fidelity was a major seller on the day of the crash and many of their orders were entered using a relatively new touch-tone phone order entry system. Previously, a large institutional investor would not have been able to place the same volume of orders as were being pushed in that day, but the order execution systems were overwhelmed by the volume. On the New York Stock Exchange, trade executions were being reported more than an hour late, which caused confusion among traders. Investors didn’t know whether their limit orders had been executed or whether new limit orders needed to be set. The automated portfolio insurance driven selling was noticed by
market participants, who feared that there would be more and more automated selling. This encouraged a number of aggressive trading-oriented institutions to sell in anticipation of further market declines. These institutions included floor traders, hedge funds, pension and endowment funds, money management firms, and investment banking houses. As they sold, the falling prices caused further reactive selling by portfolio insurers. A feedback loop was in effect. Now, not everyone agrees that portfolio insurance was to blame for the 87 crash, but most do consider it an important contributing factor.
The1988 SEC report on the crash says that these strategies were not the 'sole cause' of the crash," but were "a significant factor in accelerating and exacerbating the declines. "It’s been pointed out that other stock markets around the world crashed at the same time as the US market and most of them didn’t have any program trading or portfolio insurance products. Many international markets even had losses that were more severe than those seen in the US.
The Presidential task force on Market Mechanisms estimated at the time that 6 billion dollars out of the 31 billion dollars of sell orders executed both on the stock exchange and in futures markets were portfolio insurance trades. That comes to just over19% of sell volume on the day of the crash, so there were many other big sellers. Robert Shiller of Yale University pointed out in a 1988paper on the crash that while the idea of portfolio insurance - or using the Black Scholes Model to create synthetic options positions was somewhat new at the time, investors didn’t exactly need computers to know that selling stocks would cut their risk. Portfolio insurance just added an additional level of precision to a style of investing that had been around for a long time, where investors added to winning trades and cut their position sizes when facing losses. Shiller argues that institutional investors who adopted portfolio insurance would likely have done something similar anyhow in the absence of these new quantitative strategies. He points out that a frequent theme in the popular press before the crash was that the bull market had gone on for a long time and that the market was overpriced. He says that charts of stock prices were frequently
being discussed and interpreted in the press before the crash as showing a continuing bull market since 1982 with the question "When will it end?" Shiller points out that a book called “The Crash of 1990” by Ravi Batra was on the best seller lists in advance of the crash in 87, and that the Atlantic magazine cover story on display on newsstands at the time of the crash, had the headline: "America is about to Wake Up To a Painful New Economic Reality, Following the Biggest Binge of Borrowing and Spending in the History of the Nation." He doesn’t argue that these people predicted the crash, but instead he argues that after a long bull market, there was a general awareness that there could be a crash. He says that the big price declines in the preceding week left people wondering: Is this "it"? and because of this unusual mind set, many reacted to price declines on the day by assuming "it" (meaning the crash) was happening. George Soros makes a similar argument. He puts forth that it is a mistake to think of the stock market as being a passive reflection of investor expectations as is often done in academia. He claims that it works the other way around and market prices instead shape investor expectations.
He argues that this happens because it’s impossible for people to be truly rational in the face of real uncertainty and that the greater the uncertainty, the more investors are likely to take their cue from the stock market’s recent behavior. A rising stock market gives investors the urge to buy stocks, and when investors see others panicking, they panic too. OK, so what are the other explanations for the crash? Well, one explanation is that margin calls, and the way they were implemented on the day were likely a significant contributor to the severity of the crash. Derivatives traders, and traders who
use leverage are required to post a portion of the value of their position in an account with their broker, which is known as margin. If the value of their trading position declines due to changes in market prices, they are then required to post more margin. This is known as a margin call. The funds that are taken from the accounts of investors whose positions have fallen in value are then used to credit the accounts of investors whose positions have increased in value. At the time, the way margin accounts worked was that the exchanges first made margin calls against all of the positions that lost value and only later credited the accounts of investors whose positions had gained in value(so even if an investor had offsetting positions, they would have had to post margin on the position that lost money and would only later receive credit for the offsetting position that had made money.) Margin calls could be made throughout the day and were always done at the end of the day. For intraday margin calls, investors needed to post
additional margin within the hour; for end-of-day margin calls, additional margin was required to be posted before the exchange opened the next day. The sharp price movements in futures markets on the day of the crash resulted in record intra- and end-of-day margin calls for firms that were members of the CME clearinghouse; these margin calls were about ten times the typical size. Because of the lag between collecting margin and paying it out, these margin calls strained market participants significantly as many traders who hadn’t even lost money on their overall positions had to arrange loans to bridge this time gap. Lenders were obviously less willing to make these kinds of loans seeing the chaos in the markets, and this meant that many traders had to liquidate positions that they would not normally have done. These forced liquidations would have
added to the chaos. Another big problem on the day was that trading volume was so high that the computer and communications systems in place at the time were overwhelmed, often leaving orders unfilled for an hour or more. Large funds transfers were delayed for hours, and the Fedwire and NYSE SuperDot systems shut down for extended periods, further compounding investor confusion. Two economists who worked at the SEC, Mitchell and Netter, published an analysis in 1989 that argued that the anti-takeover legislation that had been moving through congress triggered the crash. They noted that the announcement of the legislation caused the selloff in the days before the crash, and that the stocks that led the market downward were precisely the ones most affected by the proposed legislation. Ultimately, the new law was stripped of the provisions that concerned
the stock market before it was passed. A number of analysts argue that the stock market was overvalued in the lead up to the crash. The index P/E which had typically traded at around 15, had reached 20 by October 1987. Does this mean that overvaluation caused the crash? Well, while these ratios were higher than normal in the lead up to the crash, similar P/E ratios had been seen between 1960 and 1972 and no crash had happened in that period. Another argument we can consider is that attractive long-term bond yields might have contributed to the crash.
Bond yields started 1987 at7.6% but had climbed to approximately 10% the summer before the crash. This offered investors an attractive alternative to stocks. Before the opening of financial markets on Tuesday October20th, the Federal Reserve issued a short statement that read: “The Federal Reserve, consistent with its responsibilities as the Nation’s central bank, affirmed today its readiness to serve as a source of liquidity to support the economic and financial system.” This statement reportedly contributed significantly toward supporting market sentiment.
Trading on the day after the crash was disorderly with stocks frequently being closed for trading by the NYSE specialists as order imbalances made maintaining orderly markets very difficult. Bid ask spreads were very wide reflecting floor traders’ reluctance to step in. Due to the huge volume of trades that had happened the prior day, two CME members had not received margin payments due to them by noon – as was usual. This kicked off rumors about the solvency of the exchange and its ability to make these payments. These rumors turned out to be unfounded but nonetheless
allegedly deterred some investors from trading on the CME that day. Trading on the CME and CBOE were closed early that day due to the disorderly trading. Later in the afternoon, there was a sustained rise in financial markets as companies announced stock buyback programs to support demand for their stocks. The market posted a record one day gain of over 100 points that day.
The Federal Reserve was active in the wake of the crash providing liquidity, easing short-term credit conditions, and issuing public statements affirming its commitment to providing liquidity. The liquidity support was important on its own, but the public nature of the central banks activities likely helped support market confidence. The Federal Reserve also encouraged the commercial banking system to extend liquidity support to other financial market participants, this was seen as important in helping financial markets return to more normal functioning. The 1987 crash didn’t just affect American markets. London’s stock exchange turned out to be more vulnerable than New York’s, and the Swiss market was shaken even more. The worst hit was the
Hong Kong market where a group of futures traders managed to persuade the colony’s government to suspend stock trading for the rest of the week in an effort to settle futures contracts at an artificial, pre-crash level. This ploy failed and the speculators were wiped out. The Hong Kong futures market had to be rescued by government intervention. While the Hong Kong market was suspended, selling from Hong Kong radiated to other markets in Asia, Australia, and Britain. The
selling pressure persisted for the better part of 2 weeks after Black Monday. Although other stock markets hit new lows, the New York market did not exceed the lows set in the initial selling climax. Only Japan’s stock market appeared to escape collapse. A one-day panic followed Black Monday, when prices on October 20th, fell the legal limit of fifteen percent on low volume. When the Japanese market reopened on Wednesday and there was some selling pressure, the Ministry of Finance made a few telephone calls and the sell orders disappeared. Large financial institutions began
aggressively buying stocks. The market recovered a large part of the prior day’s losses. The crash of the New Zealand stock market was particularly severe as the market continued to fall long after other global markets had recovered. New Zealand's stock market fell nearly 15% on the first day of the crash. But then the market continued to decline, bottoming in February 1988, after losing 60% of its value. Over time, markets recovered, with the following five years seeing US stock prices rise an average of 14.7 percent per year, European markets by 7.6 percent a year,
the UK market by 8 percent a year and global stock markets (as a whole) by 6.3 percent per year. Japan – the country that had appeared to avoid the worst of the crash was the only major country to suffer market losses in the years afterwards, as initial gains in the Nikkei gave way to a spectacular decline by 1990. All in, Japan’s stock prices declined by 7.2 percent a year on average over the next five-year period. Regulators learned some crucial lessons from the events of October 1987. For one, circuit breakers were introduced that were designed to temporarily halt trading in instances of exceptionally large price declines, thus giving market participants some time to gauge what was happening in the market and respond more rationally. Greater regulatory scrutiny was
also applied to trade-clearing protocols to bring uniformity to all prominent market products. Traders and risk managers learned a lot from the 87 crash too, lessons learned from the crash changed patterns in implied volatility which is used in the pricing of financial options. Equity options didn’t show a volatility smile before the crash but began showing one afterwards.
The 1987 crash had a huge effect on the psyche of traders and investors, where they learned how violent market moves can be. The crash provided a career for Nicholas Nassim Taleb who was a derivatives trader at the time and went on to write 7 – 10 books on the idea that markets can move much more than many people realize. So how much was the market down in 1987? Well, it wasn’t down. The S&P500 finished the year up a bit over two percent. If you enjoyed this video, you should watch my video on the top ten craziest fat finger mistakes next where we look at some of the biggest trading mistakes in recent market history. That’s all for now, see you again soon. Bye.
2022-08-30 17:40


