Penerapan Entry Dengan Pola Candlestick || Taking Order Using Candlestick Pattern

From these 5 candles, we can combine them. It will form the main candle pattern This is the main candle pattern *Opening Music* I give you the example for the candle pattern first These are the examples of combined candle patterns The easiest first We pay attention to these 3 red candles 1st red candle 2nd red candle 3rd red candle Red candles line up Then, after strong red candles, suddenly, Buyer comes up Next, green candle shows up Pay attention to the green candle Although green candles don't close the previous candles, but it's almost same with the red candles If we see the candlestick theory, it's Harami We still pay attention to it. Because there is changing color candle We look at the left side, is there any rejection (Support level)? If there are rejections (Support level), it can be a clue that... The changing color candle will change down trend to be up trend Then, when it rises again, we can combine these lined up candles We don't combine the tails. We don't care with the tail.
The most important thing is we see the volume power We combine the volume of candles We combine these lined red candles up Let's assume that these are the combination of 3 candles. It becomes thick and red candle So, the power of red candles become 1. It becomes super power We can also combine these lined green candles up We combine the bodies up to here It's formed like this So, the combination of candles become a pattern. It's Engulfing From these 2 combination candles, become Bullish Engulfing candle Because the previous candle is closed by green candle, it's Bullish Engulfing Bullish Engulfing means green candle will be dominant there The read candle is eaten by green candle This is Bullish Engulfing, it's same as the previous candle pattern Then, from these 2 candles, we can combine them again We can combine it here We combine the volume candle which has same tall This is if I combine it We combine the area which both of them have the same tall of body We combine them. Then, it melt. So, it becomes tail here and the rest of body is green We combine these 2 body candles So, the bodies meeting becomes long tail and the rest of body becomes tail here It will form a new pattern; Doji or Hammer Let's assume that they are same candles; reversal candle.
If we assume that it's too thick, we can call it as Hammer If it's too close, we can call it as Doji That's no problem. The most important thing is there is new pattern which we combine. It's like this There is long tail at the bottom and small body Based on the candle characteristic, this is strong Buyer rejection So, it has chance to rise The combination of candles, become Engulfing. It has chance to rise The combination of candles, become Doji. It has chance to rise
This is the combination of candles How many candles that we combine? It depends on condition. We can combine the dominant candles Next, we discuss another example This is one of the example that I give The first example is, the previous candle is red. It's followed by green candle The red candle is assumed as the first power It should be like this The changing candle is always at the right side Then, we combine these 2 candles. The melted part becomes tail And the rest becomes the body. It forms new pattern becomes Hammer It's also same like the next example. When it rose, it's closed by Bullish candle
After that, jump to this. It rose for a while, then it goes down It's closed here It doesn't eat the green candle fully We don't call it as Engulfing. But it's included in the Harami category But,. if we combine it.. don't forget that it has down potential in the Harami If we combine them, the melted part becomes tail and the rest becomes the body This is Inverted Hammer. It has chance to go down We can practice it later. We can combine it by ourselves. So that we'll know the combination of candle
Here's the example again For example, the previous green candle s.. We combine the green candles like this Then, we color it as green After that, the candle goes down like this The candle goes down We drag the body here It means that, if we combine them, Seller is still dominant Then, we draw it like this The rest of red body, which is at the bottom And the top becomes tail like this It means that Seller is dominant. there is strong Sell rejection The tail indicates strong Seller rejection So, there is potency to go down again. Although it's just 160 - 170 Pips There is clue to continue again We slide it Turns out, there is another opportunity up to here There is 300 Pips opportunity. It's more than enough to take profit It goes down a lil bit longer Turns out, when it goes down, suddenly, the movement changes The movement changes again The color changes from green to red Logically, red candle is eaten by green candle So, in this candle war, green candle win The potency is, it will be green again And so on. Including this current condition For now, the dominant is red candles We combine the dominant red candles Then, next, Buyer try to against We color it as green If we see it, it's Harami But, I've told you, for Harami, at least it's a half of it The length isn't half yet. We must be careful to order Buy
Because the power is still low It's still dominated by Seller there Except if it starts to rise quite long like this That's the application. I hope you can understand it I think it's enough for the candlestick material. Do you have any question? "Like what you explained.." "I have question about Inverted Hammer" "There is rejection. It's down pressure"
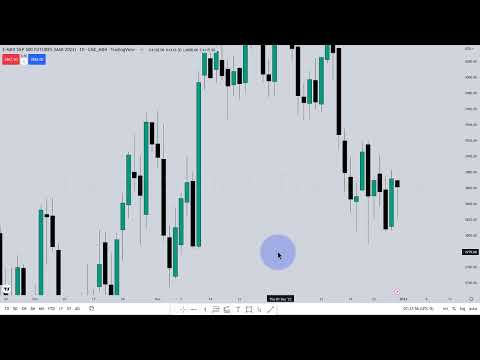
"but.." Logically, it should rise If there is rejection, for example; Inverted Hammer is at the bottom. It should go down But, the reality is the market reversed. That's Inverted Hammer. This is the example I give you the example first. The green highlight
Pay attention when the trend goes down strong Then, green candle shows up there It went down for a while, then it rises strong If red candles line up strongly, logically, Seller is dominant Pay attention to the end by end. From here to here, the candles are getting down It's also same here The candles are getting down At first, it was here. Then, it's getting down. If we drag the line, it goes down It means that it's down trend But, when there is long rejection like this, there is Inverted Hammer like this, why doesn't it go down? Meanwhile, logically, it's strong Seller rejection This is Inverted Hammer Inverted Hammer is the opposite of Hammer but the position is in the down trend If we read this candle logically, Seller rejection is very strong Pay attention at the bottom left side, it's in the psychology area 1. It's in the psychology level
2. It rose up to here. It means that it has very strong pressure Although it's rejected by Seller at the end But, its first power was up here. It rose strong up to here So, we must be careful in this condition. There are many rejections at the bottom (rejected around the Support) All of them go back to bounce again. It can be the clue that it will reverse as soon as possible; from down to rise We must pay attention to this. When it's down rejection, doesn't mean it goes down directly Because, in the history, there is important level at the left side. There is Support level which can't be breakout
That's why it goes back It's rejected to up continuously. Even it's up to this top It means that Buyer has ever reached this price. That's amazing. No wonder when it rises again for the next That's the example of Inverted Hammer Now, we talk about Hanging Man. It's at above This one is Inverted Hammer. It's at the bottom end Hanging Man is like people hanging I'll show you the example so that we have many references there To make us be more careful. So that, we won't get stuck in the continuation candle I try to show you the example of Hanging Man Hanging Man is like Hammer but it's in the up trend When it rises strong, then red candle shows up It rose for a while then it goes down red Then, it's rejected by Buyer There is Hanging Man pattern here It's in the end of up trend Logically, the body is small and the rejection is longer than the body and it's at the end of trend. At the up trend
If we drag it here, there is psychology level that was passed there There are many psychology level which were not breakout there It can be our concern Be careful when this condition shows up Because it can be clue that it will reverse First, we can see the psychology level. If it's at above, it's Resistance. If it's at the bottom, it's Support Then, we can measure the Range It's 2.400 Pips We see the last few days condition. We can combine it It's 3.500 Pips
We see the previous; it was 5.000 Pips Then, we see another Range, it was more than 5.000 Pips Even the average of the last few days, it 's around 5.000 Pips The closest was around 2.000 Pips and the previous one was around 3.000 Pips
Although it doesn't reach the Range, but when it bumps with the psychology level (SNR), Because it's at above, it bumps with the Resistance and the color starts to change. Moreover, it reaches the price that's quite long Although it's not always be long, but, when 1 pattern formed; Hanging Man, We must be careful Moreover, it's at the end of Resistance I don't recommend you to take order when it's in the important level If we want to order Buy, it's better to wait for the candle breakout from the Resistance or if reversal candle shows up like this, we can wait for the next clue; whether it's strengthen or no For example, after this red candle, the candle changes. Then, the color is green again So, we still focus on Buyer again But, when it's not closed by green candle, even it's red again, we can utilize the potency to order Sell again there Although it's not always go down, that's no problem When we take order, the first thing we think is the risk When we order Sell, we'll get loss when the market rises Measure it around 400 - 500 Pips from our order point We can put our Stop Loss around this In the 1787.49 area We run the system. Let the market runs.
Don't we think 'When we order Sell, the market goes down directly. When we order Buy, it rises directly' No one can read the market movement direction What we do is reading the probability based on the history and running candle However, the most important thing is maintaining our risk management We can put Stop Loss or we can do manual Cut Loss Like that, sir. I hope you're satisfied with the answer Later, you can do more practice If there is opportunity, we can discuss it together "Yes, thankyou, Mr. Wijaya" Well, I think it's enough for now If you have more free time, you can practice it using Demo account Then, if you face difficulty, you can ask me You may join the night class. I'll share the link in the group
Thank you, Mr. Arief. Good morning! Assalamualaikum Wr. Wb. Waalaikumsalam Wr. Wb.
2021-08-05 15:24