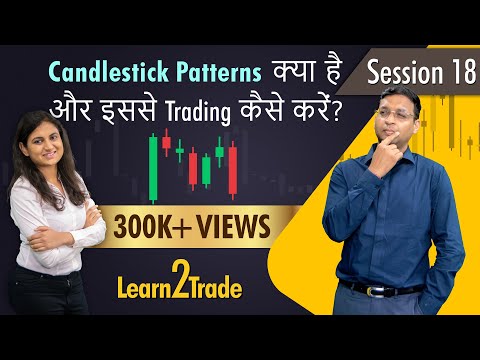
Candlestick Patterns क्या है और इससे Trading कैसे करें? | #Learn2Trade Session 18

Welcome to the 18th session of Learn2Trade series I am Vivek Bajaj and I’m teaching trading to Annapurna Hello ! Hello sir! Corona is back! Yes, hence the mask It’s good that at least one of us is wearing a masks that the chances of it spreading reduces Anyways you don’t speak a lot and don’t ask a lot of questions I speak the most, so you only wear the mask and I got the chance to speak more We are done with 17 sessions and I’ve taught you so much In fact I’m giving you all my knowledge free of cost We will have the 19th, 20th and 21st sessions as well. I’m planning to continue till 50 sessions And develop you as a multi asset trader A lot of people are asking me the reason I taught you commodity, currency I want to tell you that when you want to pursue trading as a career Then don’t keep a mindset to trade with 1 strategy in the equity market We’re learning equity, currency, commodity and more so that we can latch on to any opportunity that we get in the market All the studies that we’re learning is applicable in all the markets Be it moving average, super trend, volume, delivery They all have relevance in the market. We’ve started with equity but we will cover all Today’s topic is very good. Your favourite. You have been asking me to teach this topic for long now
But I was avoiding it but today I will teach you. It’s candlestick. Finally I’ve been showing you candle since long but I wasn’t teaching you. Candle has been in your life. The candles that we use at home There are new candles and candles with different shapes and sizes Each candle represents something. There are different candles for each occasion
Different candles for birthday, candlelight dinners. Why? Each candle looks different and gives out different vibes Each candle gives out different feeling. Otherwise there’s a standard candle Like the one in olden age, round and tall used to light up in case of no electricity It was the most standard and uniform candle but with time new shapes of candles have been developed Each candle represents something in the stock market We need to understand what it’s representing. But we’ll understand what is a candle You must remember this template where I’ve added your stocks. Till now we’ve discussed line chart
Today I’ll convert the line chart to candle. I’ve taught you the basic of candle That it represents the open, high, low, close of a particular period of time Let’s open excel. Let’s make the discussion interesting You know how much I love excelgiri. Let’s zoom it in. Date, Open, High, Low, Close. I’ll take 1st January 2021 A stock that has opened at 200, has created a high at 210, low at 198 and closed at 208 This setup is trying to represent something. This representation is known as candlestick Numbers are unable to speak to you, as these are all different numbers So it’s difficult to comprehend, but candlestick is a language of numbers You can create a candlestick in excel. I’ll just insert it. This is just for explanation
I’ll insert chart, click on all charts, click on stock, and then click on candle Candle is formed. Let’s play with this. This is a very simple candle which is showing open, high, low, close Since it’s a white candle, it means that it opened here, closed here, this was high, and this was low It’s white in excel, it can be blue or any other colour in some other software But the point here is that the close is above the open. Let’s reverse it Let’s lower the close and change it to 180. It’s dark now It’s dark as the close is lower than the open. High is 210, low is 198. Is it possible?
No, if the close is 180, so the low should be 180 atleast. The low could have been at 175 But it has to be 180, since close is 180, so the low cannot go above it Is the same concept applicable in high? Yes What are saying? Let’s change it to 220. It’s high is at 210 and closed at 220 So the high can’t be 210. It has to be 220 at least Let’s undo it. Let’s go to the previous example
Candlestick can be very complicated but I’m trying to make it simple for you You’ve understood till now What is it trying to tell you? It means that when it opened at 200, it created a low at 198 It might have created a low instantly or after going up. We don't know what happened in Intraday through this If we consider this end of the day, then we don’t know if the price went up after falling or vice versa We need to check intraday for it. This is a summary of the entire day which represents that It opened at 200, created a low at 198, high at 210 and closed at 208. Who do you think is stronger? Buyers or sellers? Buyers It looks like the buyers are stronger. If I tell you that it closed at 202 Who is stronger now? Buyers or sellers? If the high is at 210, then it means that the buyers were strong, but there are sellers also Impressive. This is not scripted. I’m impressed by your answer
It went up to 210, but someone or other sold it and closed near its low There are 3 parts of the candlestick. Body, upper wick and lower wick The body’s size shows desperation, the longer the upper wick is, means that there is an issue That why did it go down after high. A long lower wick denotes strength that someone has bought it from low Hence it came up. Each pattern has been named. Deep studies have been conducted on it
Some people just rely on candlestick to trade in the market They trade as per the pattern of the candlestick. There are 2 types of patterns in candlestick The first is the pattern formed by the standalone candle and the second is by combining 3 to 4 candles A type of candle on 3 consecutive days gives conviction of the activity on 4th day When we combine multiple candles, it forms a pattern. It also forms a pattern when you make a judgement on the standalone candle Standalone candles were relied upon more when candlestick had just started But with more complexities in the world, and as the science is becoming more public The actionable of the standalone candle is becoming weak. 2 to 3 candles are used To judge a sentiment of the 4th candle after observing the first 3 candles The stock can either give a reversal from this point or continue the trend When we try to find patterns of multiple candles, then either we look for continuation patterns That the bullish trend can continue as the 3rd and the 4th candle is representing something Or it can reverse the trend. The 4th candle is representing something else after 3 candles
There can be reversal, then go contrarian. You’ve understood the shape of the standalone candle Let’s move ahead. There are so many candlesticks here. And each candle represents something This candle is saying something. Right now we’re checking Tata Steel This is the candle of Tata Steel till now on 7th April. This was yesterday’s candle
What did this represent? The close was below the open. The sellers are more The stock has shown weakness in the stock. It does not necessarily mean that it’s weak It has shown weakness. There’s a difference between being weak and showing weakness As it was in bullish trend for so many days, then there’s a possibility of profit booking here We have to judge the intensity of selling or buying. If it has fallen down a lot from it high Then the intensity is very high and if it’s increased a lot from its low then the buying intensity is very strong The body tells you the range in the entire day. Technically the difference between high and low is called a range
But the body represents the fight between the open and close This is a pattern where you can say that there’s not a lot of activity in the stock If we see the previous day’s candle. It’s a type of pattern, you can give it any name The low was so low, but it closed quite above the low and there’s not much difference between open and close It means that it is possible for the stock to continue its rally as people are not interested in selling this stock As soon as this stock goes down, there’s a buying interest in the people Don’t go deep in the names of the candles. Sir, I have a question If we consider this candle, then the volume tower beneath it, can it be red? When we’re designing this system, then you need to see it holistically You cannot make a judgement by observing the standalone candle I’m adding all my lessons to your template. I have added volume, delivery, and supertrend If you see an uptrend in the stock because of supertrend and moving average and the candle’s shape is giving you comfort of a positive shape, then it’s an added information You judge these 5 indicators, candles, price actions in your template And when the majority of it convinced you, that’s when you enter Let’s insert all candlestick patterns. If I go to settings, then you see the selected patterns You can select more like hanging man, harami, morning star. They’ve already created patterns for you You get an indication here, BE. It’s an engulfing pattern.
At the end of the given uptrend, a reversal pattern will most likely appear It means that engulfing is a reversal pattern. During the 1st stage, the pattern uses a small body It is then followed by a day where the candle body fully overtakes the body from the day before it And closes in the trend opposite direction It means that it merges 2 candles to form a pattern, that is known as engulfing I don’t want to create a video for each pattern as these are self-explanatory Which is there on the internet. So that’s not my objective. My objective is to tell you That there are various types of patterns, some patterns will work most of the time Some pattern may not work as each stock will have a propensity to react on a certain set of patterns You’ll get to which pattern works best in which stock with experience There’s an operator in each stock. So it’s not unnecessary for morning star to work in the same way in all stocks
You’ll develop this over a period of time with practice I have a question. What will a pattern with a long wick and a single line in between denote? That means there’s no body in between denoting that the open and close is same If the lower wick is longer, then it means that there’s more buying with the same open and close If the upper wick is longer, it means that there’s more selling with the same open and close If there’s buying from above, it denotes strength and if there’s selling from below, it denotes weakness You need to check the length of the wick and size of the body A long body means more volatility and more fights and more uncertainty A long wick means more conviction of entry and exit. Always go inside each day’s candle. How do we do that? By converting the chart This is a candle of the daily chart. If I have to go inside the candle then I will convert it to intraday chart We’ll see the 2-hourly chart. The candles here will represent the activities on a 2-hourly basis
If you convert it to hourly, it will create candlesticks that gives you a judgement of the stock on an hourly basis If you want to make a judgement of a candle on the EOD basis, don’t do it by tracking the daily candle If you feel that there’s a unique candle formed, then go inside it and check intraday Try to evaluate which candle in the intraday represents a resourceful activity It’s important to identify the important candle. Why? Each candle is trying to show a trend and there has been an entry or an exit of an operator in it If an operator has entered a candle then it’s low is important for us. If it breaks then the operator will also worry And if the operator exits or shorts, then that candle’s high is important A relevant candle’s high and low are important numbers for you which could be a stop loss Or it could be a part of a demand or supply zone. There are 3 ways of setting stop loss One was based on price. High, low of day or week. A candle helps you to find out a candle Whose high and low are more important. The important candle whose can be set up as a stop loss A longer candle denotes more fights and the low of that candle is important when someone wins after the fight Candlestick is a better representation of the market. Line chart is an incomplete representation
You understand the activities of the market deeply when you convert it to candle The more you go deep into it, the more you’ll be able to understand and it’ll help you to form judgements My suggestion would be to start with 5 patterns. Google the top 5 candlestick patterns Start identifying those 5 patterns. You can use tradingview or I’ll give you a better suggestion Go to web.stockedge.com. You’ll see candlestick scans when you go to scans We have created a list of stocks that fulfills a candlestick pattern and I have got it categorized Bullish, bullish continuation, bullish reversal, bearish, bearish continuation, bearish reversal We have covered the major candlestick patterns in it. What does bullish continuation scan mean? The continuation of the bullish trend. There are 2 types of patterns - Neckline and Upside Tasuki Gap
If we go to neckline and click on it, you'll get the definition. A tall red candle is followed by a green candle near its close on its neck It means that a tall red candle is formed and then a green candle is formed which is closed near the neck of the red candle Neck means the upper part of the body in the candle. Face, body, neck The green candle has closed near that point. It’s so deep Someone has created it. It’s like alphabets and someone is creating words There can be so much creativity in creating the words. Multiple patterns can be formed with multiple candles and there’s continuous innovation in it You can identify your own pattern as well I have a question, how does this denote a bullish trend? This has been defined Whoever created this has defined it that because the close is near its neck So the probability of it being bullish is high. How does he know this?
He has back tested it for years and saw that it works 70% of the time And concluded that there are chances of this continuing the bullish trend Let’s see another one. Let’s see a bearish scan. Black Marubozu We have given all the definition in the i in stockedge. So don’t worry but you need to check all Marubozu is a 1 day candlestick pattern in which there is a long red real body and no or small upper shadow extending from the body. It means that the body is red, long and no or small upper shadow extending from the body It means that the upper wick is very small or there’s no wick. It’s called Marubozu If it’s red, then it’s a bearish Marubozu, and bullish Marubozu if it’s green. We see the stock Trent in the list which shows this pattern We see a negativity in Trent and it’s supposed to continue as per this candle Doesn’t mean that we will sell, but we will note it down. It’s negative as per our pattern
Price action will decide when to sell. Check the demand and supply zone before selling It’s not needed to sell the next day in the morning. There’s another way to benefit from the study of candlestick that multiple parameters There are a lot of scans available in StockEdge which I will discuss with time When you create a combination after merging multiple parameters Stocks where moving average is high, with a high delivery and there’s a candlestick pattern in it When you scan it and you get 2 to 3 stocks, that’s when you know that these are effective stocks Candlestick has a major role in scanners. Trading with standalone candlesticks And expecting a high returns is something I’m not sure about Only candlestick has not helped me but other frameworks along with candlestick That gives me conviction is a better framework. Go slow in the start
Understand the application from the shape and size of the candle Mark the highs and lows as these are important levels, especially for identification of demand and supply zone Generally I track 2 time frames - daily and 2-hourly. I don’t track the candlesticks daily I value the closing more as the closing price is more important to me But I track the high, low in 2-hourly chart, as I’m able to judge the operator’s activity better Should I consider the low to mark the support? Low If it has gone down at the same point consecutively and if the low is same in the last 2 days Then it’s an important low. Tracking only the closing price is deceptive but if you track the low Then you get a better judgement of the operator’s position in intraday High for marking resistance. If the resistance is at multiple points or high Don’t draw one line for support and resistance. This is not the right way
It’s not required that they all come at the same price. Draw a range of demand zone or supply zone Create a parallel channel instead of a straight line. You’ll see a range by joining the two high Last time its high was 883 and this time its high is 885. It’s a zone between 883 and 885 Don’t draw a single line as it can be deceptive. Let’s see below If we merge these two lows, then it becomes a demand zone and the above is the supply zone Is this convincing? Yes. This is on hourly basis. Let’s check it on a daily basis
You can get a single point on a daily basis but there will be 2 to 3 candles which hit hourly If 2 to 3 candles are hitting the same bottom, then you know that it’s a convincing support zone Or a convincing demand zone Let’s start practicing it as it can go to any extent of your learning It’s a good science to start learning but if you want to go to advanced on it There are good books on it to go deep into it but we’ll conclude this for now This was a small introduction video on candlestick. I have tried to explain it in a simple way So that you understand the relevance of this pattern. You can start practicing this now As the more you practice, the more you’ll move towards perfection Thank you for watching this video and sharing my effort with others I’m getting good responses and it makes me happy to see you all benefit from this Annapurna is taking its benefits, you can also benefit from this Thank you. Bye
2021-04-16 12:12


