Analisis XAU USD hari ini 19 Juli 2021, Menguji Sejauh Validitas analisa sederhana | Analyze XAU/USD

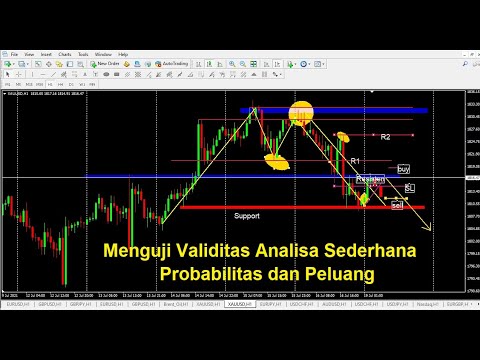
Good morning everyone wherever you are This morning, we'll try to map the XAU/USD movement with H1 Time Frame as the standard Today is Monday, 19th of July 2021 at 06.34 To read the future movement is quite early There is much time to take position Go back to the chart, we pay attention to the daily Time Frame first We enter the daily Time Frame first and we erase these first We draw the Trend generally If we see the big trend direction of D1 Time Frame, Buyer is still dominant there Then, if we see the closest structure from running, which is yesterday There was quite long correction This one If we see the length, it's almost same like the 2 previous candles It's almost same Then, how about the today's probability? Will it continue to go down or rise? Well, we go back to H1 Time Frame first In D1, we don't find thing that's too prominent We see the daily Time Frame, Buyer is still dominant although there was quite long correction in a day Then, how we take the order point and the opportunities? We try to draw it This is if we draw the Trend line in the H1 Time Frame We see at this top, there is psychology level area which isn't breakout We mark it as blue At the top, there is psychology level there Then, we see the trend direction The psychology level isn't breakout, it means that it's hard for buyer to press Even Seller is more dominant Because we use short-term trading style, we use the closest trend direction to running The closest from running is go down So, we focus on Sell now Because current candle is green and the previous 2 candles were green, To make sure or go back to the down Trend first, to determine our Sell order point It's better to let this rise first as strong as possible If it rise and unable to rise again, it changes to be tail, and Seller's body start to be thick, We may order Sell there Because Seller is still dominant; Seller still has amazing power in H1 Time Frame with short-term structure, The Trend direction still go down, we can drag the line This is if we drag the line The trend direction still goes down We just wait for Seller momentum Seller momentum when it's unable to rise again then it changes to thick red candle The top has axis, we can order Sell there We focus on Sell, before Buyer has big power Although some previous candles have green color However, it's still not strong enough to drag the Buyer higher We try to draw the line, if it rise, where will it stop? If it goes down, where will it stop? We try to draw the line for the psychology level which is at above Why? Because now, the direction goes up or it's green We drag the up psychology level It's to test whether Buyer is strong to pass it or bumped to go down So, the illustration is like this When it rise, we test it here If it rise, it's breakout to up or strong, We can also order Buy there. We can utilize the opportunity to order Buy there When we order, don't forget to think the risk We put the risk based on our own risk management, it could be 400-500 Pips or in the closest Support level Maybe it's here There is Support level here Or the psychology level if we put it here, that's ok If we measure it.. It's around 300 Pips. Put it more under We can put the SL here The SL is here We can see the number.. At 1814.57 We can see it there We mark that this is up psychology level or we can drag it as the closest Resistance Then, if it's breakout again, we can see the next psychology level Where is it? Because no one else is nearby, we can see the Retracement It's here, then we can drag it here for the Retracement We mark it with different color It's to test to the next level Turns out, the Retracement level close to the next psychology level There is also rejection here There is also rejection here This is the Retracement of the structure that was formed before This is the most dominant. We take the Retracement or the correction
Then, if it's still able to rise again we can see at this top as the next psychology level Why don't we take the upper? Maybe it's here or here We determine the closest psychology level with hope that we can detect the opportunity earlier Then, the last is at this top These are important areas, when it rises, it's in the psychology area It's better to wait for it's breakout or reversal Then, if it's not breakout in this first Resistance area, Then, it starts to be rejected by Seller It's proven by; 1. it could be rejection in the form of axis which changes to thick red candle or the rejection could be in the form of Seller which starts to show up there For example, before it's breakout, there will be Seller that start to show up There is candle or Bearish Red candle which starts to show up, there is confirmation candle Then, we can also order there when the impact of Seller which show up will affect the next candle It could be the red candle is only 1, it's small. But it's line up as 2 candles or even 1 candle but it has quite long impact This is the example It also indicates that Seller press Buyer strongly or maybe it's small and start to line up We can utilize the order Sell here It's as illustration if it bounce We can input the Sell here with the SL We see at the top, maybe it's around like what I said. It's in the Resistance area, we can put the SL Of course when red candles starts to show up The problem is, the candle is still in the green color. We still wait for it until it's breakout
or until the reversal clue show up Now, it's still in the correction area, we observe it first Don't against the big direction first Now, Buyer is dominant. Buyer show its power in the running candle and the previous candle don't forget that we also see the opening here It's opened by dominant buyer Although now Buyer is strong, don't forget that the trend direction is still strong to go down Then, after this opening, it hasn't gone down yet It's closed by green candle. It means that there is no Seller yet there There is still down potential Then, we see the economic calendar Is there any News that will be released? Today is Monday, 19th of July Based on the economic calendar, there is no News that will be released We focus on the technical The direction of the first psychology level will be here if it goes down It becomes the closest Support level When the condition is still like that When Buyer is still in the Resistance area for maximum When on the next some candles it's breakout the Resistance, So, we postpone our Sell mindset first We follow the direction which is closer to running Then, if it's breakout in this middle, we can utilize to order Buy there If green candles line up, follow the flow We utilize the Buy opportunity When it rises long, wait for the correction, There is tail at the top, measure the axis distance. If there is space to take profit, we take Buy position there
As long as it's not breakout, don't take Buy position first It's too dangerous if we speculate there Although generally, the big Trend rises, but we see the closest from running For now, it's mastered by Seller If it's not breakout and it starts to be red in this area, the movement tend to still go down Although generally, it's still strong to rise We see the easiest and the closest to running Because we use short-term trading style I hope there is overview. I hope it's useful For the next step (looking for the trigger), you may apply it by yourself Which step that you suit to order. Whether when it's running or when the rules are qualified At least, 2 rules or when it's strong to rise, we utilize the down opportunity with principled that Seller is still dominant there Thankyou, everyone! I hope it's useful and you can get consistent profit Although the profit isn't too much, the important thing is getting consistent profit first Good morning!
2021-07-20 20:16


