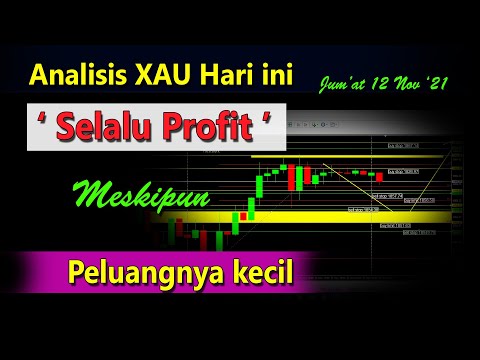
Analisa XAU Hari ini Jum'at 12 Nov, Selalu Profit Meski Peluangnya Kecil || Always Get Profit

Good morning traders wherever you are who are monitoring XAUUSD chart now! today is Friday, 12 November 2021 at 07.24 A.M It's still early morning to map today's movement potential and utilize the opportunities Because it's still in the morning, many opportunities which we can take But before that, I try to read D1 time frame In D1, Buyer is strong. It's still dominant. No meaningful rejection there however, it doesn't mean the market will continue to rise even though up trend is still strong Remember that there is psychology level (resistance) Where the market starts to stop in that area and rejected If we see the market in this large time frame, there are many rejections at the left side Many rejections here We try to map the large time frame first There are many rejections at the left side It becomes the resistance Although there is higher psychology level The candle can't touch the resistance, it means that there are many rejected prices The psychology level also can't be passed Even though it has 2 potentials, but we'll see the condition later We try to analyze the market history Started since the last 2 days, In this green candle Bullish was still dominant with Seller rejection There was long wick on top. The length was same like the body Buyer was still dominant with same Seller power (compared to the body) It means that we must be careful with Seller pressure which will show up Then, we see yesterday's market. It went down around 647 Pips at 1842.xx However, because the trend is strong, It's still rejected again Then, it's stopped at the end of high and rejected again The yesterday's high was under the previous high. There is decreasing momentum of Buyer
This area could be the highest psychology level So, it has potency to do correction or sideways in that area. At the end, it could rise back when it breaks the 1868.xx When the candle can't breakout anymore and Seller show up.. It's a clue that the movement will reverse We'll see how the candle formed which strengthen Sell position later When Seller position isn't strong yest, we wait for it until there is dominant (breakout or Seller formed) That's about large time frame Then, we look at the lower time frame to read the opportunity and trigger We enter H1 time frame to make it easier There are psychology levels on top and bottom in H1 time frame As you can see, there are many wicks on top We can focus on Buy after it passed the psychology level We measure it Now, it starts to go down although the candle hasn't finished yet We look the candle movement history The highest point was rejected at the left side Then, it rises again and rejected again Seller pressed strongly until 1854 area It was rejected and closed by red candle Even though Buyer tried to rise again, it's still rejected again then, it tried to rise back and rejected I'm getting sure that this is the highest top area So, it has chance to reverse (from rise to down) or even correction We look at the closest psychology level here We test it in the 1858 area first then, we test it again in 1855 area the point is there is space to take profit there Then, we measure it using Fibonacci retracement with Buyer power there I color it differently We color the Fibonacci differently I color it as red We can draw Fibonacci line there so that we'll find the retracement area The first is in this area We'll try to draw the line at 1853 the second is at 1851 area We drag the retracement line to the left side This is the retracement area When Sellers start to line up, we test it in 1853.95 and 1851.63 When it's still there, it has bounce potential When it bounces, the big possibility is it will continue to rise It goes back to the main trend But, I'm still not sure because there are many rejections on top So, it's also tested in the psychology level area We test it at 1865. It becomes the highest retracement To test the candle whether it's strong to rise or no when it breaks out there, we can take Buy Stop position We give it near space But, we tend to running market later Because it's too far and on top, it's vulnerable to put Buy Stop there We can utilize the Limit at 1868 when the market moves later Now, we still focus on Sell. Because market goes down..
We wait for it. Let it pass the closest psychology level first We'll take position when the market breaks out We measure it and determine the pending order We can put Sell Stop there at 1857.74. We put it here. Then, we can take Sell opportunity again under it when the candle passed... When it's in the psychology level, we can take the limit quickly It means that utilizing the correction We can put Buy Limit at 1856.50 (in the psychology level)
Remember that Buy limit isn't for taking big opportunity but only utilizing the correction Because the opportunity goes down Based on the closest history, many bumps on top. It still has chance to go down until the retracement area We can take Limit opportunity in the retracement area When 1856.50 area is passed, The distance is near. We take Stop opportunity here We can take Sell Stop here We can put Sell Stop at 1854.38 The profit target is in the 1852 - 1851 We can take Buy Limit at 1851.63
It's to utilize the correction When we utilize the correction, we need to be fast We focus on Sell when the candle is near to the retrace level We can take Sell after the candle breakout at 1850.14 We can make it closer there The Sell Stop is at 1849.78 Don't forget to always apply risk and money management Then, we pay attention to the latest candle structure Then, look at the psychology level at the left side and the last formed candle include the impact It can be clue Well, we try to make the top movement simulation when the market reverses When the market reverses from down to rise We can take Buy Stop (that's the closest) buy Stop when it passed the open price/opening candle So, we can put it at 1826.97 then, the target is at the psychology level. It's around 200 Pips
We can take Buy Stop on top When it's passed We'll see the latest condition later we'll only make the simulation with the potential and possibility by reading the history We can continue it using Buy Stop at 1867.14 We'll see the progress while we pay attention to the numbers which close to the psychology level The number isn't always be same like what I explained. You may adjust it with market condition So, it's really same like the target It could move like this at the beginning then it could reverse from what we planned The most important thing is we must prepare risk management When the pending order is touched, we must anticipate it soon Always prepare the risk limitation wherever we put it About risk limitation, you can use percentage, Pips, or the closest psychology level I hope it can be useful I hope there will be no problem for tonight class. We'll evaluate this morning market Last night, we also evaluated the yesterday morning market and there were many profit potentials It means that what we analyzed in the morning, had profit potentials There was limit on top, it was touched There was Stop at the bottom, it was touched There was Sell Stop at the bottom, the market went down and we got it It means that we can utilize the opportunities even though they are small If the morning movement is like this, market could move bigger So, from this opening area, it will always move 1 way. If it doesn't rise, it goes down The perk of morning market is.. the movement isn't too extreme and we can anticipate it using pending order
I| hope you can practice and modify it using your own character good morning! Greetings of two-way profit!
2021-11-13 09:52


